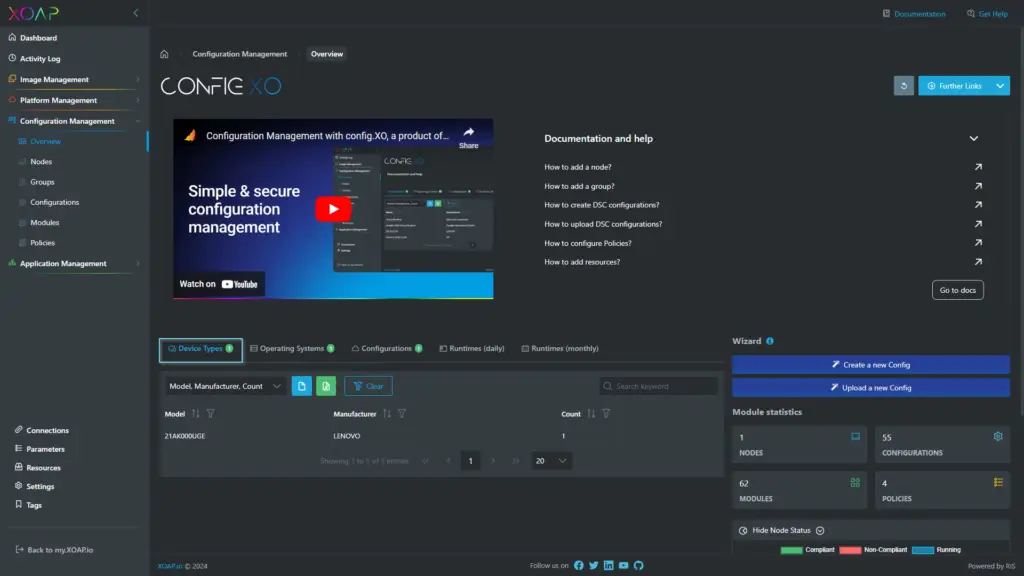
Device types #
The device types overview gives you a quick overview of the different device types in your environment. You can see the number of devices per model and manufacturer.
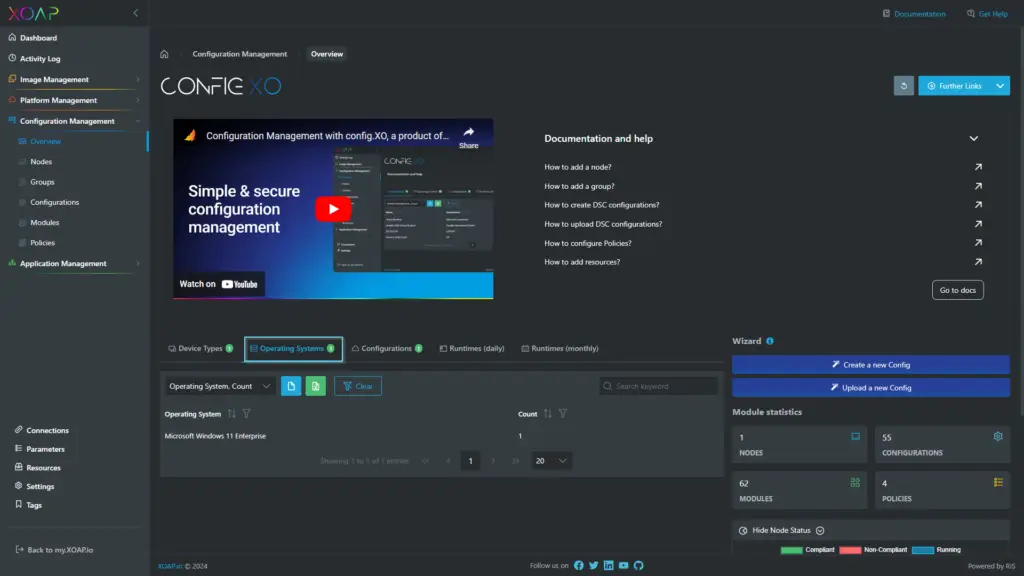
Operating systems #
The operating systems overview gives you a quick overview of the different operating systems in your environment. You can see the number of nodes per operating system.
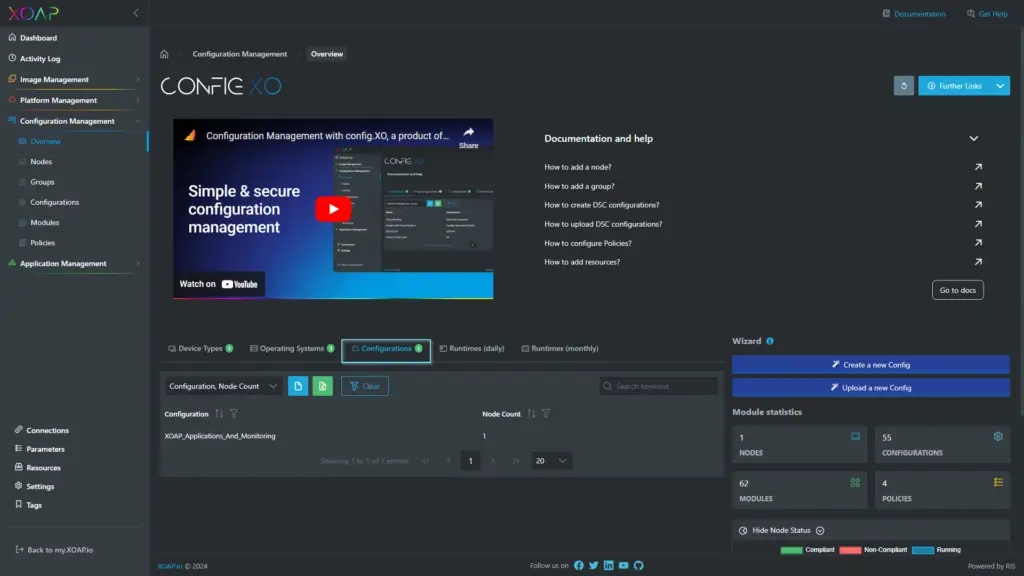
Configurations #
The Configurations overview gives you a quick overview of the different configurations in your environment. You can see the number of nodes assigned to the configuration.
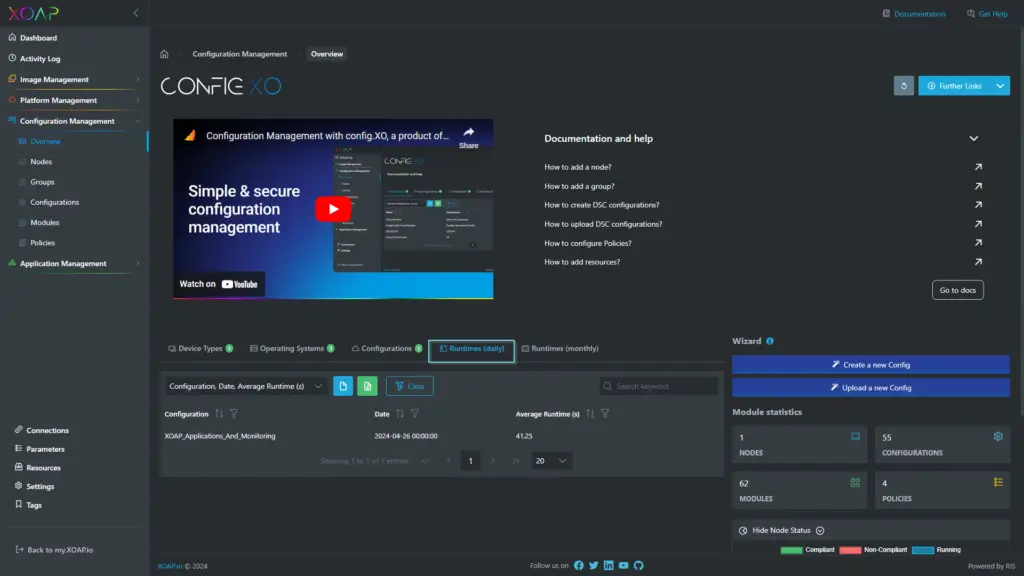
Runtimes (daily) #
This is a quick overview of the different average runtimes per configuration per day.
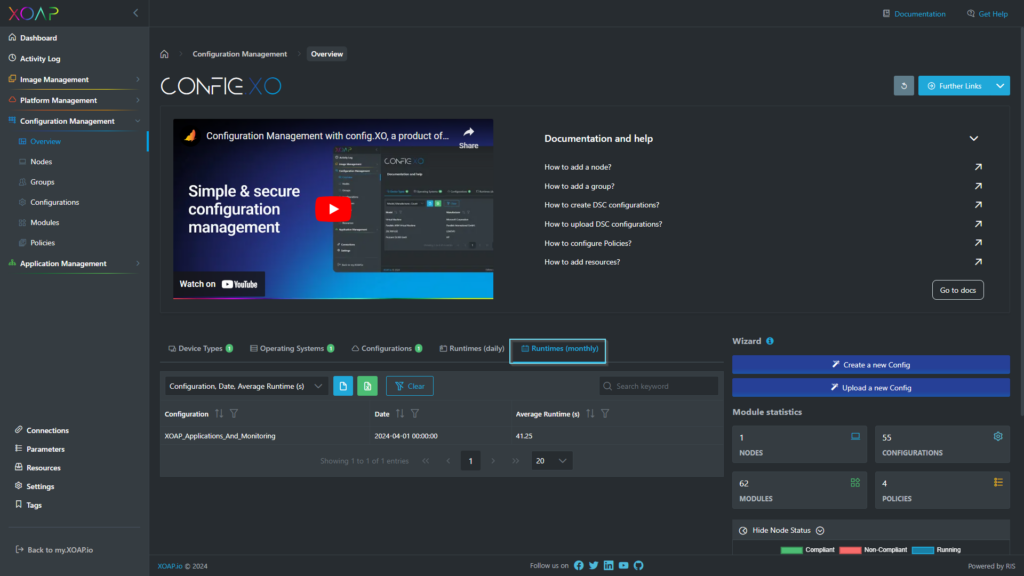
Runtimes (monthly) #
This is a quick overview of the different average runtimes per configuration per month.
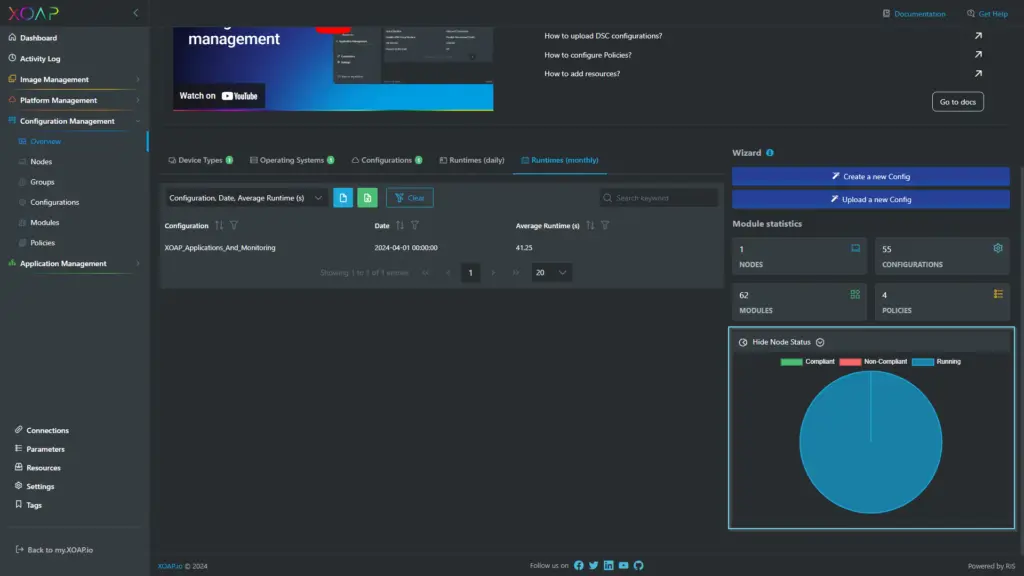
Node Status #
This is a quick overview of the different node statuses in your environment. You can see the number of nodes per status (Compliant, Non-Compliant, Running).
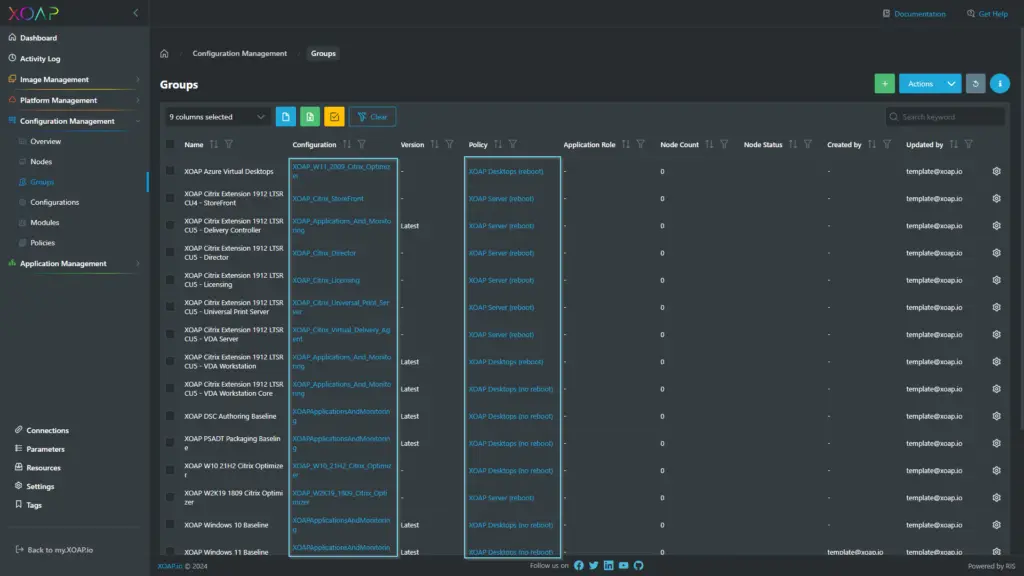
Dynamic links #
Below you see an example of dynamic links in the console. They are shortcuts inside the data tables to the corresponding areas – in this case to Configurations and Policies. With these, you can navigate easily to the area to continue the working process.
Module statistics #
The widgets on the right show the following data:
- number of connected nodes
- number of created DSC configurations
- number of integrated DSC modules
- number of created LCM policies
Wizards #
The wizards are the main entry points to the Configuration Management module. They guide you through the process of creating and uploading a DSC configuration.